

Site Health Dashboard was built to remove friction. From installation to execution, it’s all local, simple, and fast. A bundled InstallShield wizard handles the heavy lifting — from installing Python to setting up dependencies and browsers — so you can launch straight into diagnostics without worrying about technical setup.
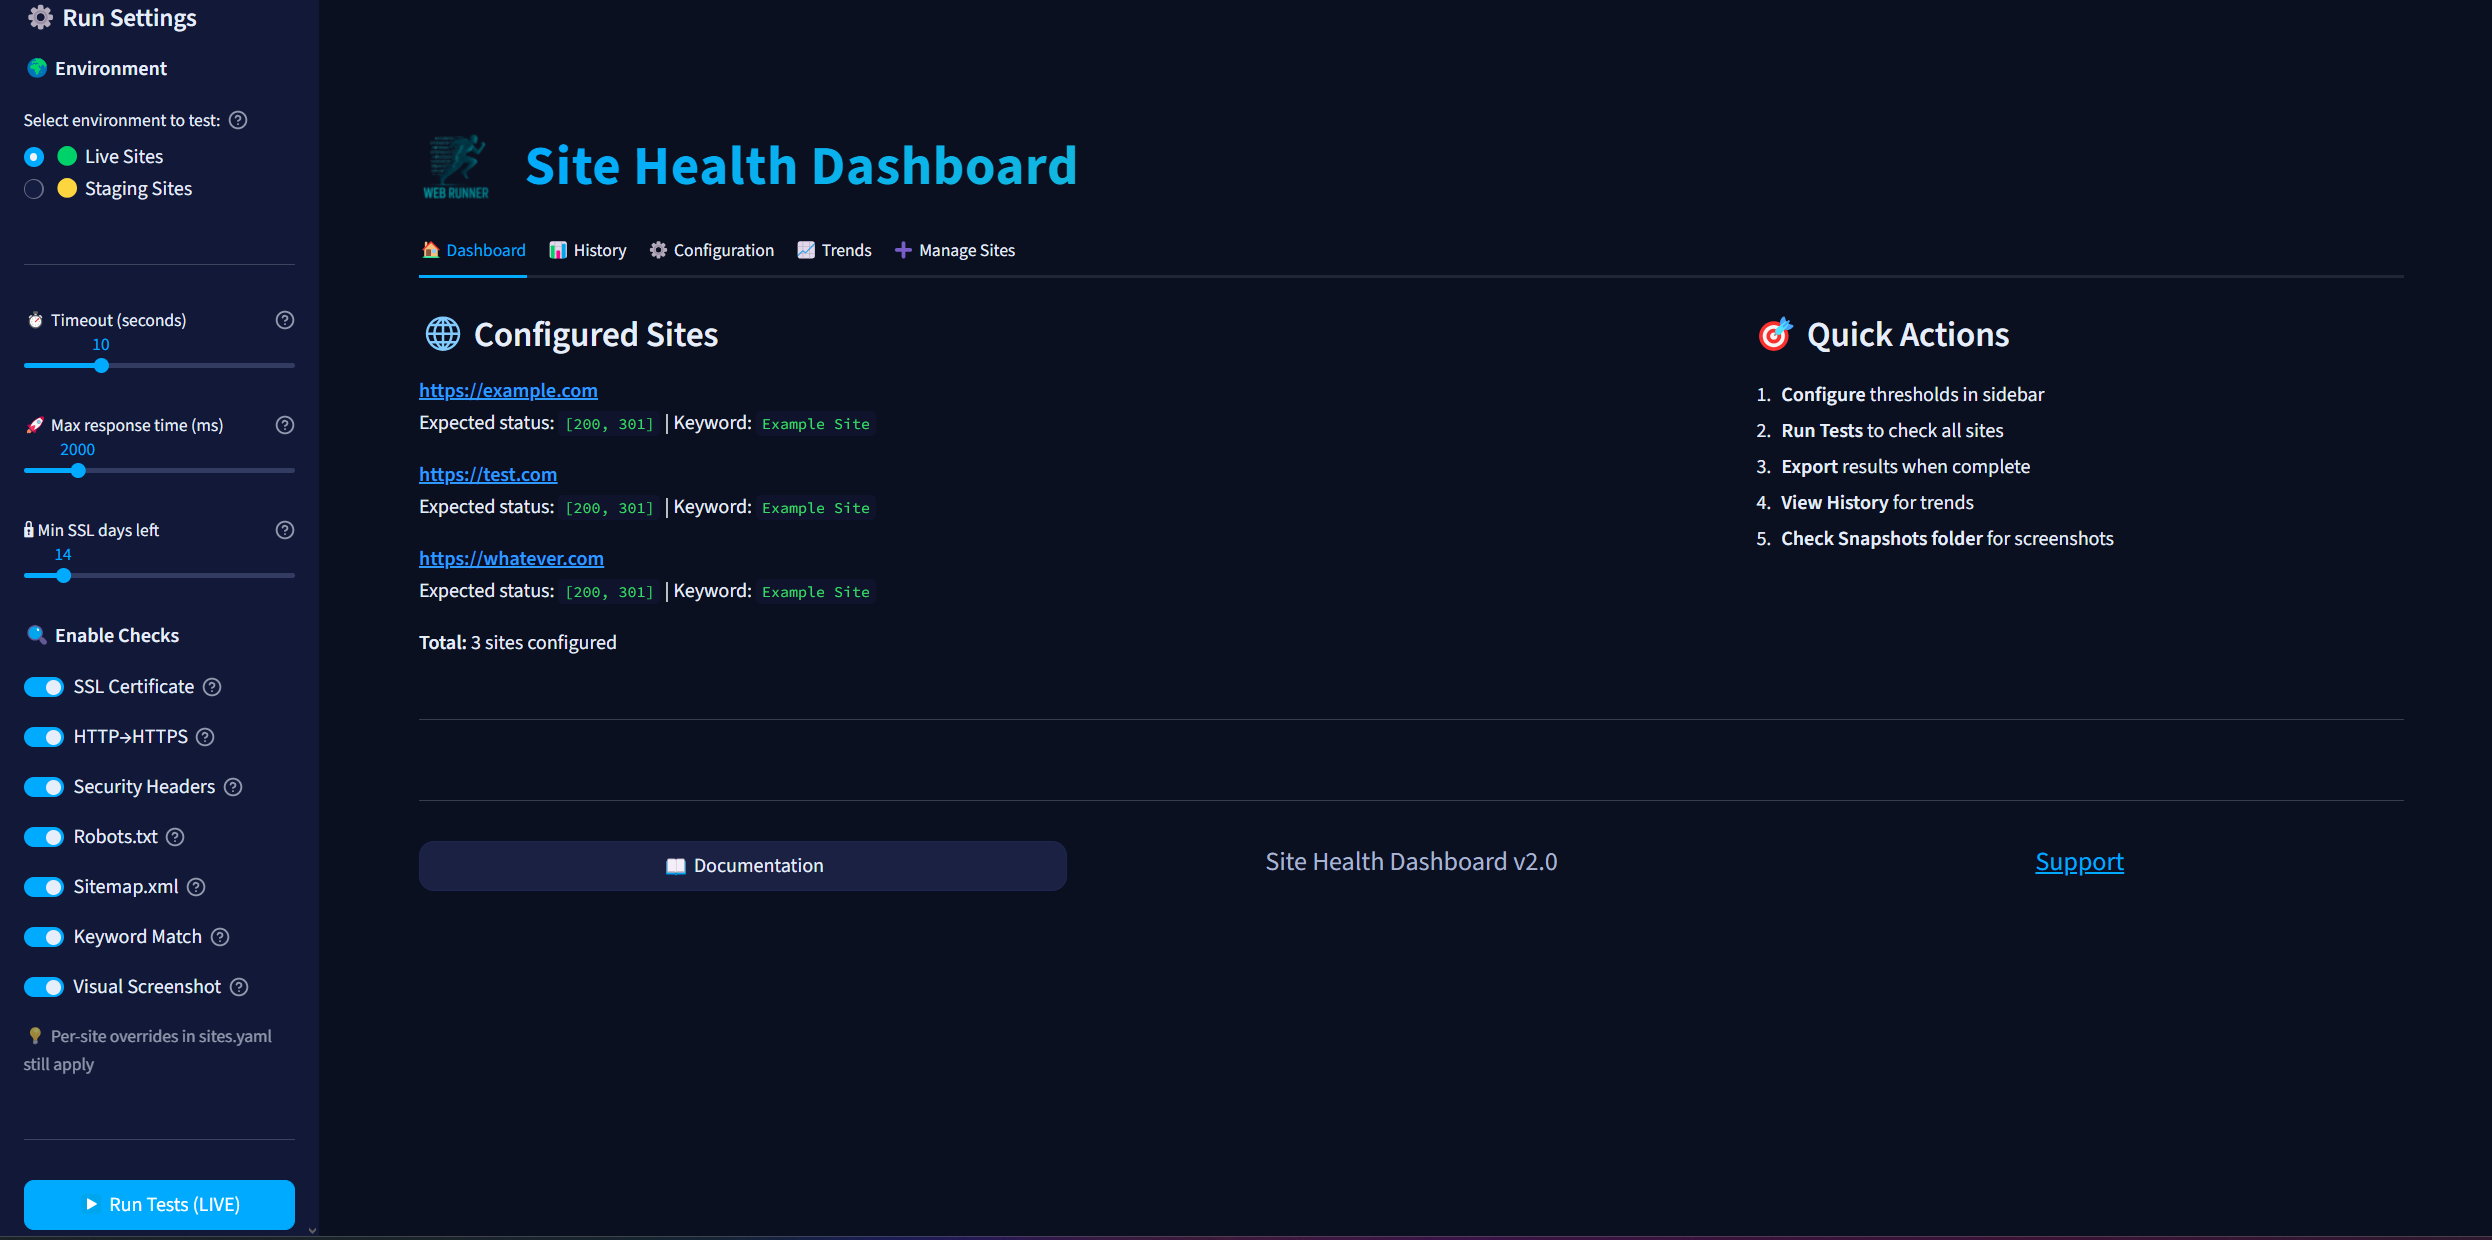
Once launched, you’re presented with an intuitive interface where you can add domains, define expected HTTP status codes, and configure optional tests like keyword validation, security headers, sitemap checks, or SSL monitoring.
Not all HTTP 200 responses are created equal. Sometimes, your site may appear "up" while silently failing — rendering error messages or blank states due to backend issues. By using the Keyword Check feature, you can define content that must be present on the page (e.g., “Welcome”, or your brand name). If the keyword isn’t found, the test fails — flagging subtle content delivery issues.
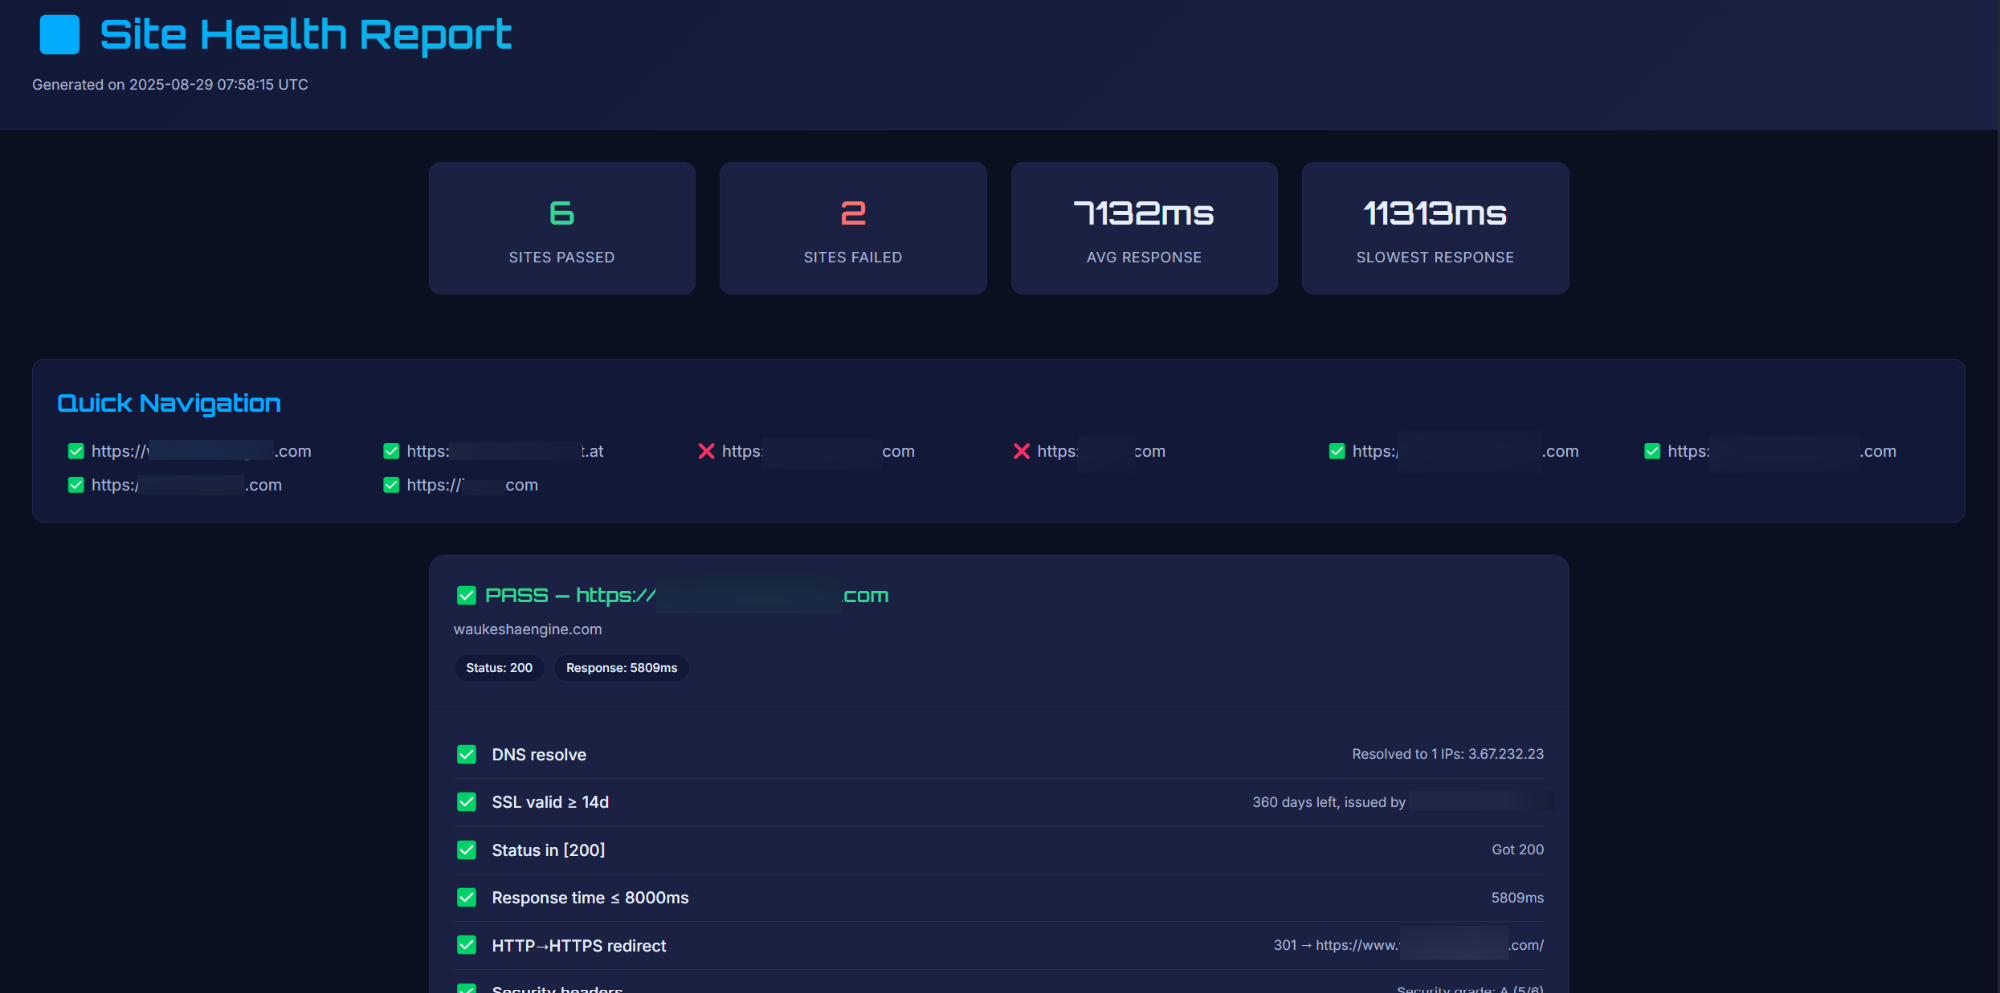
Automatically inspect your response headers for critical security configurations (e.g., Strict-Transport-Security, Content-Security-Policy, etc). Each test is graded A to F. Any grade below B is flagged. This helps teams enforce baseline standards — useful during audits, penetration tests, or compliance reviews.
Ensure your public sitemaps and robots.txt are accessible and correctly structured. Essential for SEO and crawlers. Quickly validate that search engines can reach your most important pages.
Never get caught with expired certificates again. Site Health Dashboard inspects certificate expiry dates and lets you know which ones are close to renewal — so you can stop managing SSL renewals in a separate spreadsheet.
Configure acceptable response times per test. The default is 2000ms — but if your application is known to load slower (e.g., large CMS sites), raise the threshold to avoid false positives. Anything above your limit is flagged as degraded performance.
Enable screenshots to visually capture the full rendered homepage during each test. These snapshots are archived for future review. Ideal for catching regressions or styling issues introduced during deploys.
All historical test runs are logged and saved locally — including status codes, performance metrics, errors, and screenshots. Reports can be exported as .html, .json, or .csv.
The full documentation is available from within the app, but you can also view it online — just click the “Check Documentation” button below (coming soon).
The Trending tab gives you an at-a-glance visual breakdown of how your monitored sites are performing over time. It analyzes recent test data and compiles it into charts that highlight which sites are consistently fast, slow, or problematic.
Use this to spot performance decay, detect patterns across environments (e.g., staging vs production), or simply compare which domains are your best and worst performers. The goal? Prevent fire-fighting by detecting drifts early.
Every test run is logged and timestamped — even if it fails. The History tab lets you drill into past results by site, including status codes, response times, keyword checks, SSL status, and more.
You can also filter by “Pass” or “Fail”, and quickly jump to screenshots for any given run (if enabled). It’s your incident archive and performance ledger, all in one place.
This is your control center. Add new sites, remove old ones, or switch between environments (live vs staging). Each site can be configured independently. More options coming soon!
Whether you're onboarding a new client, testing pre-launch domains, or segmenting your own infra — this tab keeps everything organized. No YAMLs, no config files — just click and go.
- Enable screenshots only for production sites to save storage.
- Use keyword checks on critical pages like login, checkout, or landing pages.
- Set higher response thresholds for large CMS sites, and lower for APIs or static pages.
- Export failed runs in .html for sharing with devs or support teams.
- Monitor both www and non-www versions of your domains to catch redirect or cert issues.
Most uptime tools rely on cloud dashboards and background polling. Site Health Dashboard is different — it’s fully local, private, and built for developers, sysadmins, QA teams, and solo builders who prefer precision and control over subscriptions and logins.
Whether you’re monitoring 5 sites or 50, for staging or production, this tool gives you clarity — instantly.
We use cookies to boost performance & UX.
These are the backbone of the matrix – without them, nothing works. Login sessions break, preferences vanish, chaos ensues. They are always on, non-negotiable.
These enable “enhancements” like embedded videos, slick animations, and contact forms that don’t puke. Without them, things might still work – but barely.
When enabled, we silently monitor traffic patterns like a digital stalker, but without personal info. Just raw behavior signals to help us patch, tweak, and optimize your journey through the datastream.
These let us show you stuff you actually care about – like plugin updates, deals, or epic releases. No shady ad tracking. Just Web Runner intel for operatives who want it.